User sgmoore uploaded the image
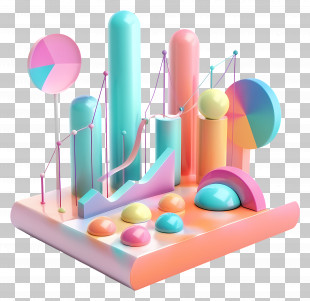
A 3D rendering of a colorful abstract composition. The composition is made up of different shapes and colors, including blue, green, orange, yellow, red, and pink. The shapes are arranged in a way that creates a sense of depth and dimension. In the center of the image, there is a white rectangular base with a grid-like pattern. On top of the grid, there are several colorful spheres of different sizes and colors scattered around. The spheres are connected by thin lines, creating a network-like structure. The overall effect is a vibrant and dynamic composition.
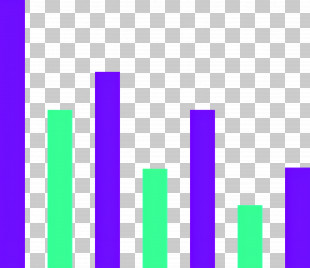
Graph - Colorful Data Visualization For Analytics PNG
. The resolution of this PNG file is 4060 x 4028 pixels and it has a file size of 7.16 MB.A 3D rendering of a colorful abstract composition. The composition is made up of different shapes and colors, including blue, green, orange, yellow, red, and pink. The shapes are arranged in a way that creates a sense of depth and dimension. In the center of the image, there is a white rectangular base with a grid-like pattern. On top of the grid, there are several colorful spheres of different sizes and colors scattered around. The spheres are connected by thin lines, creating a network-like structure. The overall effect is a vibrant and dynamic composition.
You might also like...