User dollarjune47 uploaded the image
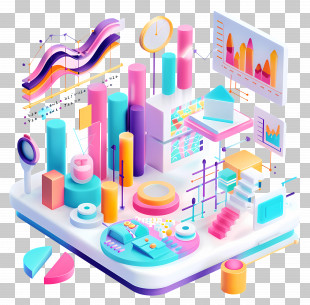
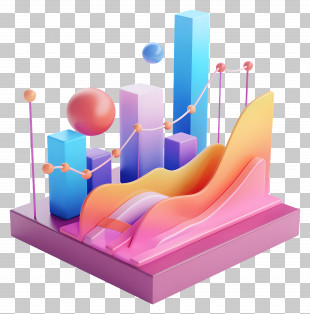
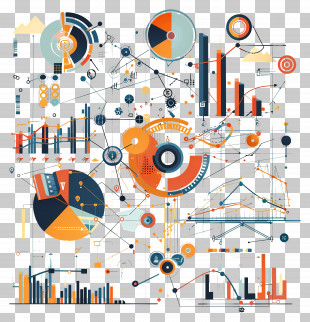
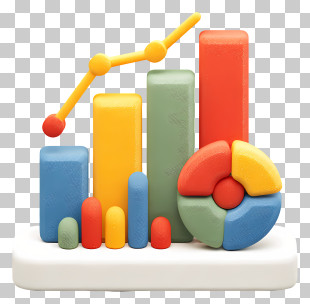
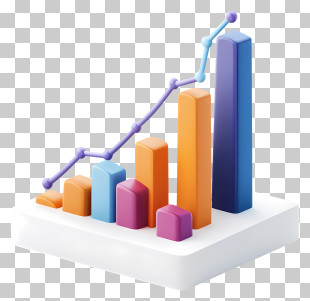
An illustration of a table with various graphs and charts on it. The table is white and has a pink background. On the left side of the table, there is a pink bar graph with a blue line going up and down, representing growth or progress. Next to the graph, there are several colorful bar graphs in different shades of pink, blue, and purple. On the right side of this table, on the bottom right corner, there appears to be a pink pie chart with a green arrow pointing upwards. In the center of the image, there seems to be an infographic with some text and graphs. There are also several smaller graphs and diagrams scattered around the table. The overall color scheme of the illustration is pink, purple, and blue. The image has a modern and technological feel to it.
Statistical Data - 3D Data Visualization Illustration PNG
. The resolution of this PNG file is 3956 x 3824 pixels and it has a file size of 6.69 MB.An illustration of a table with various graphs and charts on it. The table is white and has a pink background. On the left side of the table, there is a pink bar graph with a blue line going up and down, representing growth or progress. Next to the graph, there are several colorful bar graphs in different shades of pink, blue, and purple. On the right side of this table, on the bottom right corner, there appears to be a pink pie chart with a green arrow pointing upwards. In the center of the image, there seems to be an infographic with some text and graphs. There are also several smaller graphs and diagrams scattered around the table. The overall color scheme of the illustration is pink, purple, and blue. The image has a modern and technological feel to it.
Statistical Data - 3D Data Visualization Illustration PNG
You might also like...