User acallan1 uploaded the image
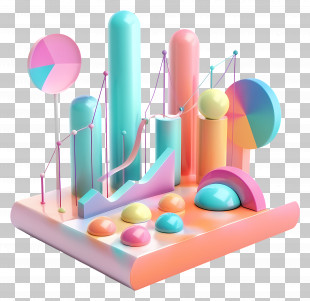
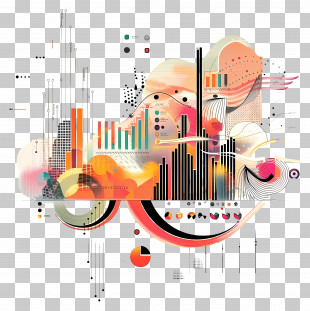
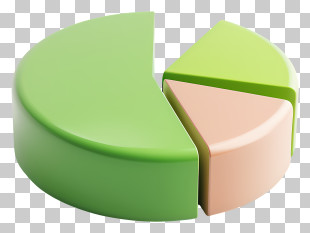
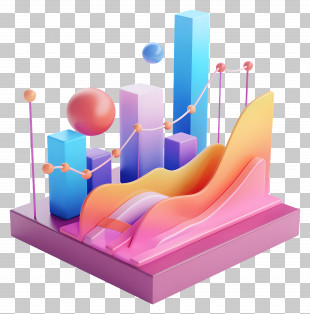
An isometric illustration of a table with various graphs and charts on it. The table is white and has a rectangular shape. On the left side of the table, there are several colorful bar graphs in different shades of pink, blue, purple, and orange. Next to the bar graphs, there is a blue computer tower with a graph on top of it. On the right side of this table, on the bottom right corner, there appears to be a pie chart with different colored bars representing different data points. The bars are arranged in a grid-like pattern, with some overlapping each other. There are also several smaller graphs scattered around the table. The overall design of the image is modern and minimalistic.
Statistical Data - 3D Data Visualization Elements Art PNG
. The resolution of this PNG file is 3816 x 3880 pixels and it has a file size of 6.15 MB.An isometric illustration of a table with various graphs and charts on it. The table is white and has a rectangular shape. On the left side of the table, there are several colorful bar graphs in different shades of pink, blue, purple, and orange. Next to the bar graphs, there is a blue computer tower with a graph on top of it. On the right side of this table, on the bottom right corner, there appears to be a pie chart with different colored bars representing different data points. The bars are arranged in a grid-like pattern, with some overlapping each other. There are also several smaller graphs scattered around the table. The overall design of the image is modern and minimalistic.
Statistical Data - 3D Data Visualization Elements Art PNG
You might also like...