User jaymaccx21 uploaded the image
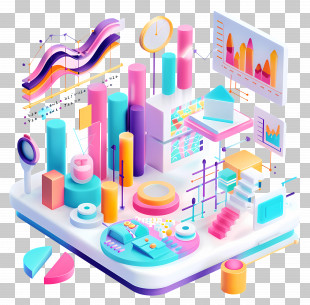
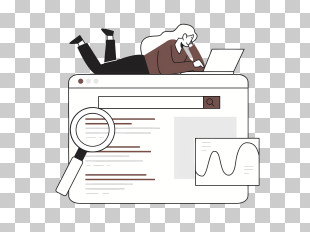
The image shows a man sitting on a red bar graph. He is wearing a blue t-shirt and jeans and is holding a laptop in his lap. The graph is divided into three sections - pink, blue, and purple. The pink section is on the left side of the image, the blue section is in the middle, and the purple section is at the bottom. There are also two red and blue spheres on the graph, which appear to be graphs or charts. The image appears to be an illustration of a person working on a laptop.
Data Analysis - Graph And Data Analysis Illustration PNG
. The resolution of this PNG file is 5404 x 3320 pixels and it has a file size of 2.48 MB.The image shows a man sitting on a red bar graph. He is wearing a blue t-shirt and jeans and is holding a laptop in his lap. The graph is divided into three sections - pink, blue, and purple. The pink section is on the left side of the image, the blue section is in the middle, and the purple section is at the bottom. There are also two red and blue spheres on the graph, which appear to be graphs or charts. The image appears to be an illustration of a person working on a laptop.
Data Analysis - Graph And Data Analysis Illustration PNG
You might also like...