User LoveSMS uploaded the image
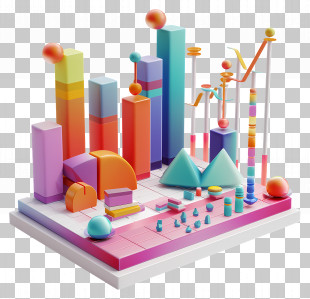
A bar graph with three vertical bars. The first bar is blue, the second is orange, and the third is yellow. The bars are arranged in a horizontal line, with the blue bar on the left side and the orange bar in the middle. On the right side of the graph, there is a small orange sphere. The graph appears to be a visual representation of data or statistics.
Bar Graph - Colorful Bar Chart For Data Visualization PNG
. The resolution of this PNG file is 1760 x 1668 pixels and it has a file size of 700.95 KB.A bar graph with three vertical bars. The first bar is blue, the second is orange, and the third is yellow. The bars are arranged in a horizontal line, with the blue bar on the left side and the orange bar in the middle. On the right side of the graph, there is a small orange sphere. The graph appears to be a visual representation of data or statistics.
Bar Graph - Colorful Bar Chart For Data Visualization PNG
You might also like...