User mega2017 uploaded the image
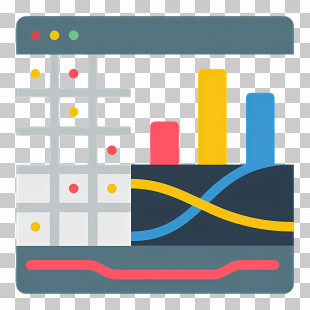
An illustration of a computer screen with a bar graph on it. The bar graph is divided into six sections, each with a different color - purple, orange, and green. The purple section has a line graph on the top right corner, while the orange section has an orange line on the bottom left corner. On the top left corner, there is a green pie chart and a purple line graph. The overall design is simple and minimalistic.
Data Chart Illustration - Data Chart And Graph Analytics Illustration PNG
. The resolution of this PNG file is 6252 x 6252 pixels and it has a file size of 2.81 MB.An illustration of a computer screen with a bar graph on it. The bar graph is divided into six sections, each with a different color - purple, orange, and green. The purple section has a line graph on the top right corner, while the orange section has an orange line on the bottom left corner. On the top left corner, there is a green pie chart and a purple line graph. The overall design is simple and minimalistic.
Data Chart Illustration - Data Chart And Graph Analytics Illustration PNG
You might also like...