User EchoFiveSeven uploaded the image
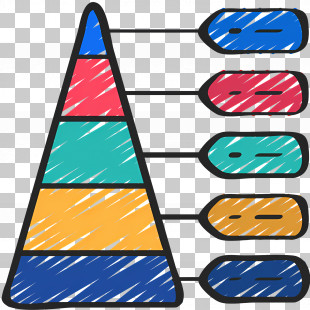
The image shows two rectangular icons with a transparent background. On the left icon, there is a list of colorful checkboxes with a red checkmark in the center. The checkboxes are arranged in a grid-like pattern, with each checkbox having a different color - pink, green, yellow, orange, and blue. The icons are connected by a thin blue line.
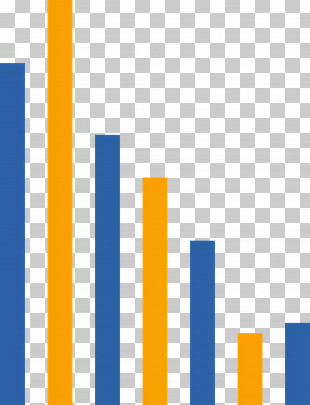
Infographic - Comparison Chart Diagram PNG
. The resolution of this PNG file is 2048 x 2048 pixels and it has a file size of 400.42 KB.The image shows two rectangular icons with a transparent background. On the left icon, there is a list of colorful checkboxes with a red checkmark in the center. The checkboxes are arranged in a grid-like pattern, with each checkbox having a different color - pink, green, yellow, orange, and blue. The icons are connected by a thin blue line.
You might also like...