categories
background remover
login
create account
Sign Up
Login
Background Remover
Image Editor
Categories
Colors
Help / FAQ
Save
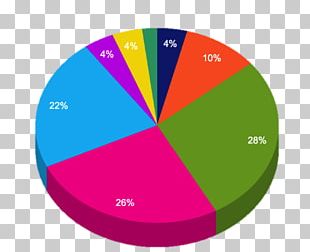
This PNG image was uploaded on January 22, 2018, 3:35 pm by user:
MSF
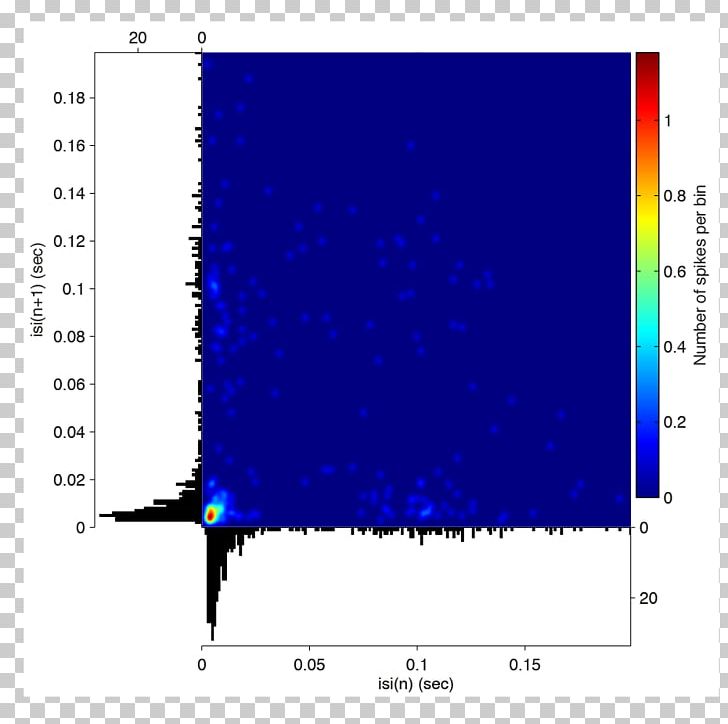
and is about
angle
,
area
,
blue
,
chart
,
color mapping
. It has a resolution of 930x930 pixels.
Angle
Area
Blue
Chart
Color Mapping
Data Preprocessing
Field Trip
Fieldtrip
Gnu Octave
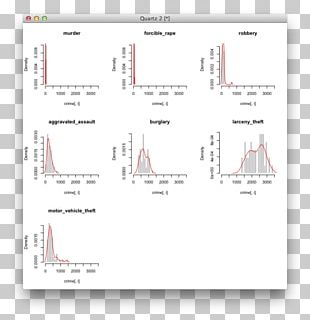
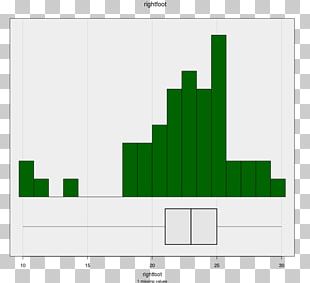
Histogram
Line
Matlab
Others
Plot
Purple
Rectangle
Red
Scatter Plot
Square
Standard Deviation
Text
Free Download
(71.80 KB)
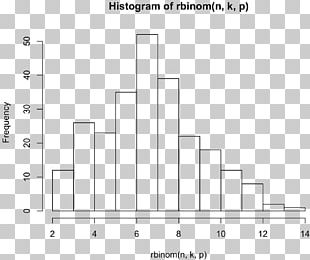
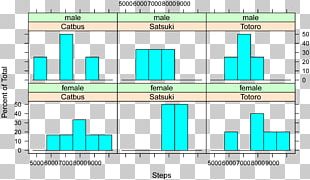
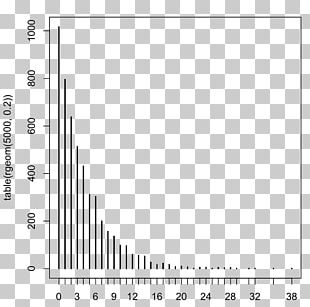
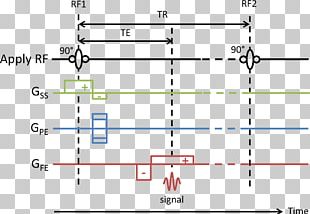
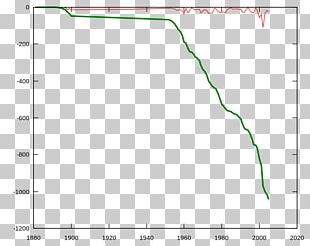
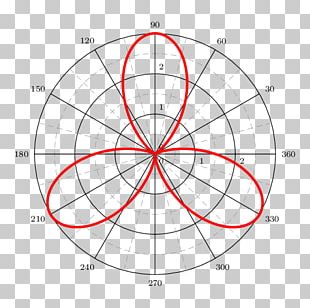
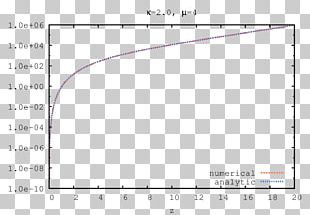
Peristimulus Time Histogram Chart Plot MATLAB PNG
Edit PNG
AI Background Remover
930x930
71.80 KB
January 22, 2018
PNG (300 DPI)
MSF
Send Message
You might also like...
Most recently uploaded images...
Forgot your password? No problem...
After clicking the Request New Password button, you will be redirected to the frontpage. You will then receive an email with further instructions.
Request New Password
Sign up and start downloading in seconds... totally FREE
Sign up with your social network
Google
Facebook
Twitter
or use the form below
By clicking the "Sign Up" button you confirm that you agree with our
Terms of Service
,
Privacy Policy
and our
Notification Settings
.
Sign Up
Already have an account?
Log In
Log back into your account...
Login with your social network
Google
Facebook
Twitter
or
Login
No account yet?
Sign Up
Forgot your password?