User kesseltim uploaded the image
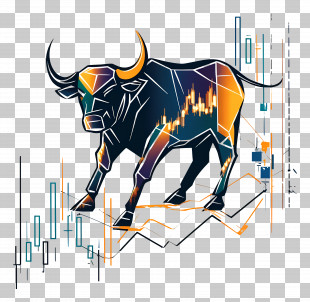
A graphic representation of a stock market chart. It has a transparent background with a yellow rectangle on the left side. On the right side, there is a green line graph with a downward trend. In the center of the graph, there are six red and green candlesticks arranged in a vertical line. Above the line, a gold coin with a dollar sign is placed on top of it. The overall color scheme of the image is red, green, and yellow.
Stock Market - Stock Market Chart With Candlestick Indicators PNG
. The resolution of this PNG file is 2048 x 2048 pixels and it has a file size of 786.98 KB.A graphic representation of a stock market chart. It has a transparent background with a yellow rectangle on the left side. On the right side, there is a green line graph with a downward trend. In the center of the graph, there are six red and green candlesticks arranged in a vertical line. Above the line, a gold coin with a dollar sign is placed on top of it. The overall color scheme of the image is red, green, and yellow.
Stock Market - Stock Market Chart With Candlestick Indicators PNG
You might also like...